Graph 1– Logistics Performance in Q1 vs Q2:
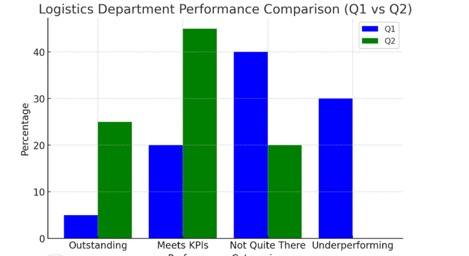
A notable performance advancement took place in the Logistics department during Q2. During the same period outstanding staff members grew from 5% to 25% as underperforming workers decreased from 30% to 0%. The implementation of efficient performance management techniques led to improved outcomes due to their basis in training methods, leadership development and motivational strategies.
Graph 2- Column Chart: Administration department in Q1
\
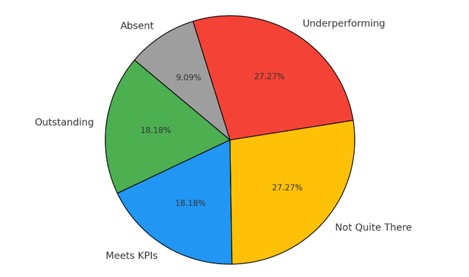
This pie chart shows the Administration department staff performance management percentages throughout the first quarter of year. About 27.27% of the employees fall under “Not Quite There” and “Underperforming” categories as shown in the graphical analysis. Of the total 50 employees in Administration department 18.18% received “Outstanding” and “Meets KPIs” evaluation ratings and 27.27% received “Not Quite There” and “Underperforming” ratings. At the same time 9.09% of the workforce did not receive any ratings. Better performance management and improved support systems should be implemented to enhance company productivity levels.
Graph 3: Horizontal Bar Chart Showing the Total Bonus Payment for Each Quarter
Please click the following icon to access this assessment in full